Generalized Autoregressive Score models
Background

Generalized Autoregressive Score models were proposed in their full generality in Creal, Koopman and Lucas (2008) as developed at the time at VU University Amsterdam; see the GAS papers section of the site. Simultaneously, Harvey and Chakravarty (2008) in Cambridge developed a score driven model specifically for volatilities, called the Beta-t-(E)GARCH model, built on exactly the same philosophy. The Beta-t-(E)GARCH is a special case of a GAS model.
The idea is very simple. Consider a conditional observation density \(p(y_t | f_t)\) for observations \(y_t\) and a time varying parameter \(f_t\). Assume the parameter \(f_t\) follows the recursion
$$f_{t+1} = \omega + \beta f_t + \alpha S(f_t) \left[\frac{\partial \, log \, p(y_t | f_t)}{\partial f_t} \right],$$
where \(S(f_t)\) is a scaling function for the score of the log observation density. The key novelty in this expression is the use of the scaled score to drive the time variation in the parameter \(f_t\). It links the shape of the conditional observation density directly to the dynamics of \(f_t\) itself.
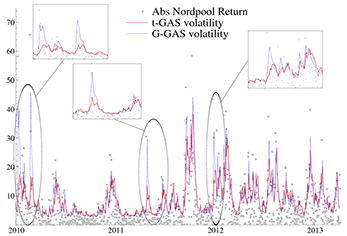
For example, if \(p\) is the normal density and \(f_t\) its variance, then by a convenient choice of scaling we obtain the familiar GARCH model. If \(p\) is a Student's t density, however, we do NOT obtain the t-GARCH model! Instead, the score of the t distribution causes the volatility dynamics not to react too fiercely to large values of \(|y_t|\). This makes sense: such large values might easily be due to the fat-tailed nature of the data, and should not be fully attributed to increases in the variance. An empirical example of this effect is given in the figure on this page.
If \(p\) is the exponential distribution with mean \(f_t\), then we obtain the ACD model. In fact, many well-known models fall in the GAS framework, and many new interesting models with time varying parameters can now easily be devised.
Given the data up to time t, \(f_{t+1}\) is known. The model is thus observation driven in the terminology of Cox (1981) and the likelihood is known in closed-form through a standard prediction error decomposition.
Additional lag structures and other dynamics can be easily added to the transition equation for \(f_{t+1}\) above. More details can be found in the original 2008 working paper, a shorter version of which is published as Creal et al. (2013) in the Journal of Applied Econometrics.
Contributions from research team across the world are warmly welcomed. Please let us know if we missed your paper on GAS or score-driven models by filling out the form.